Back
Energy Management: Dashboard, Meters & Reports
About the Project
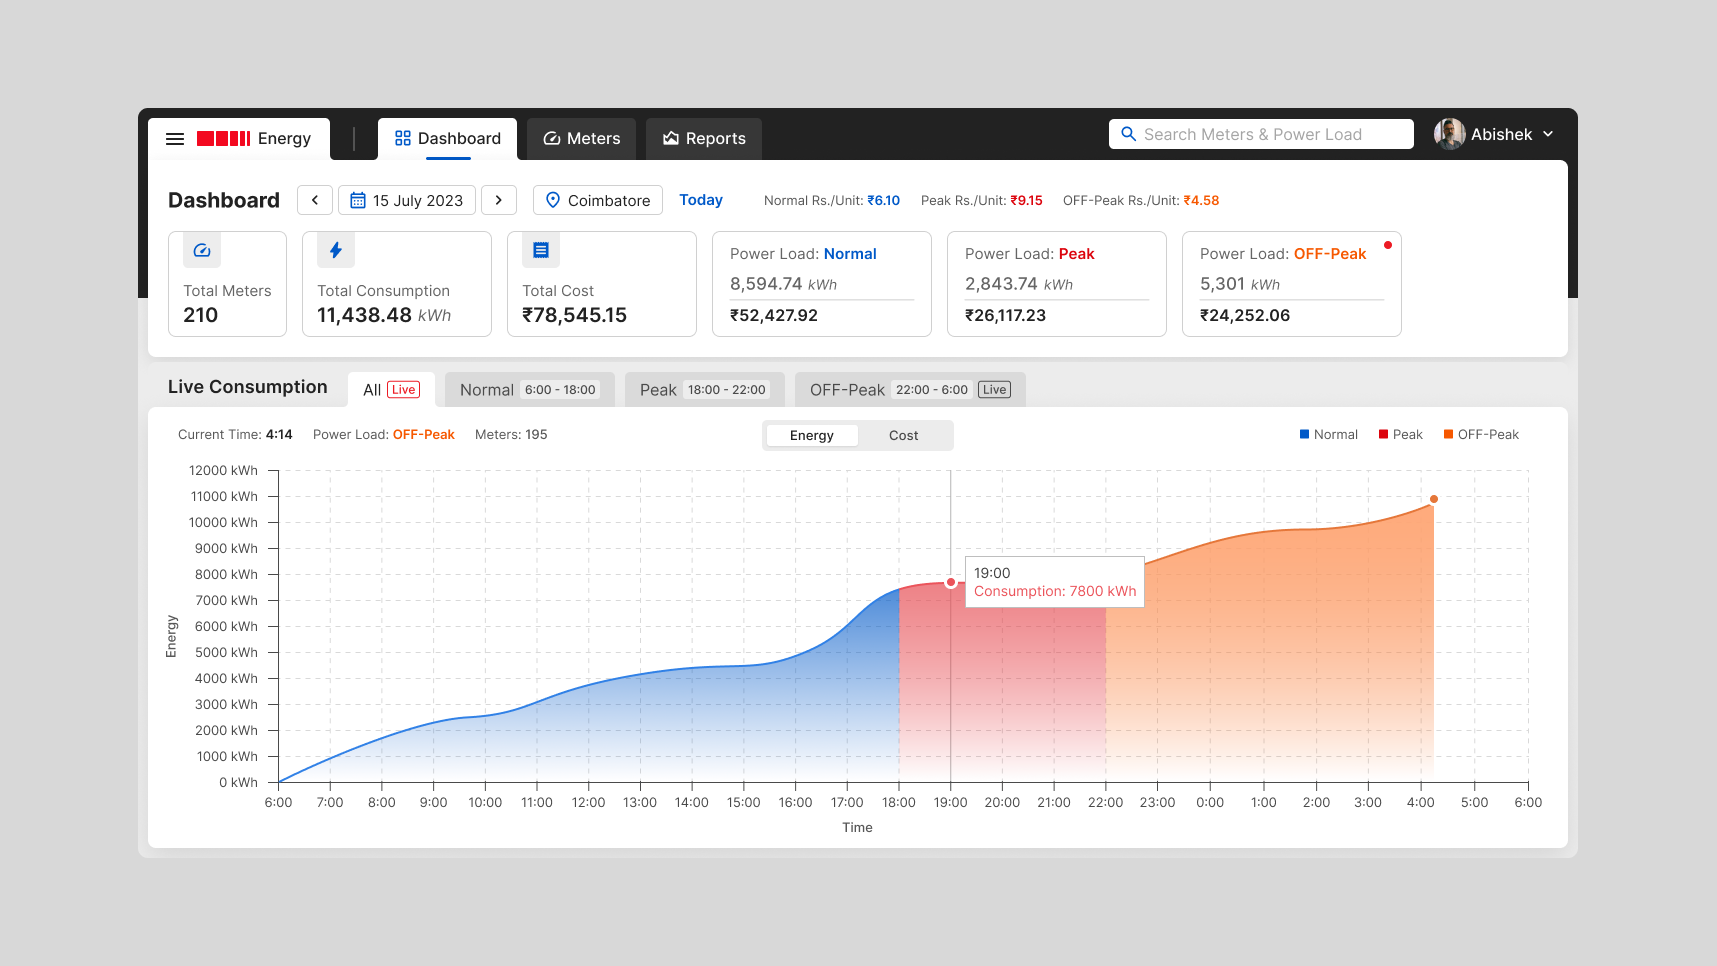
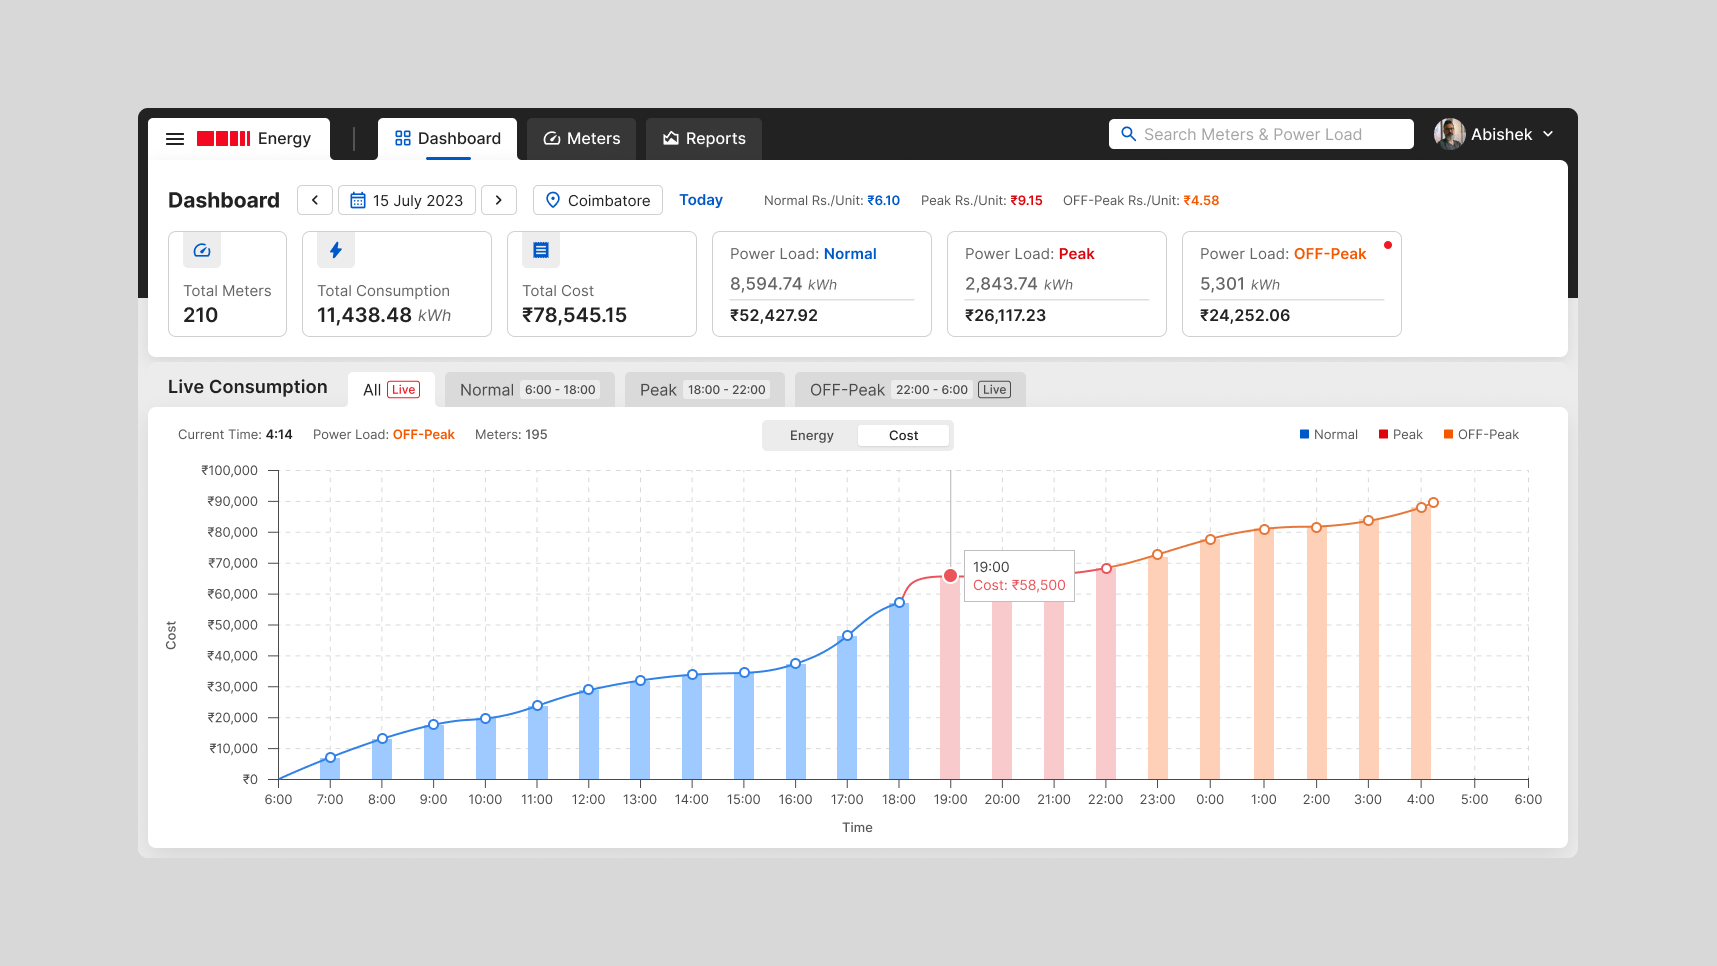
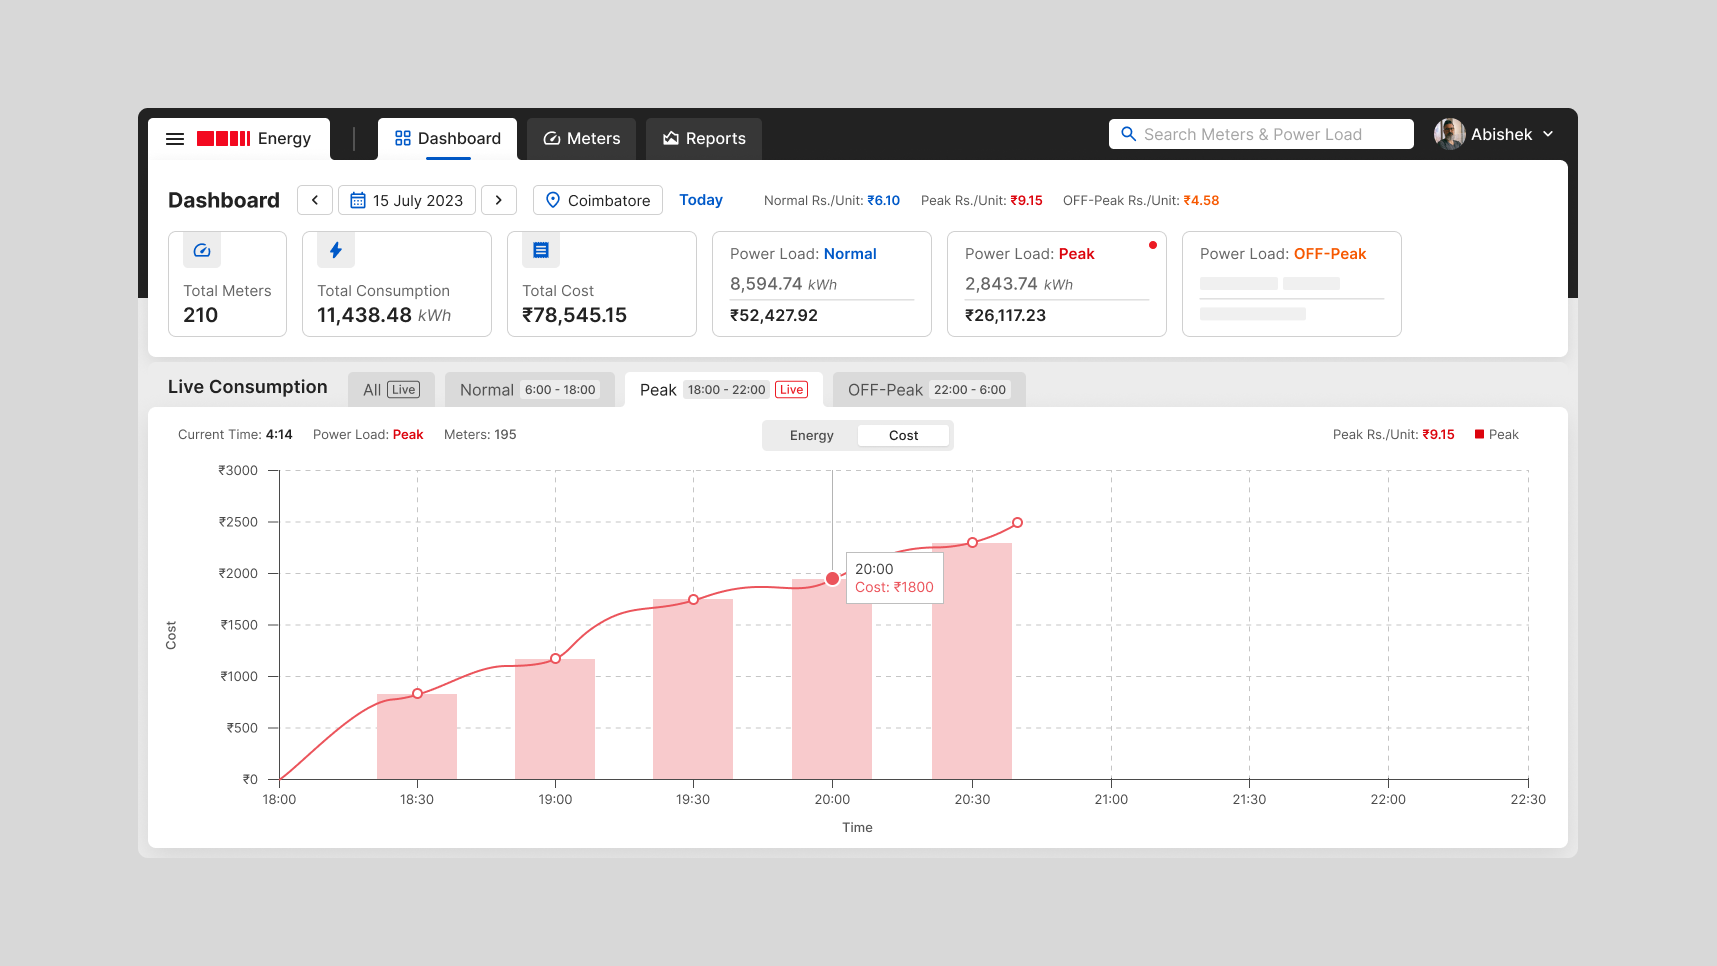
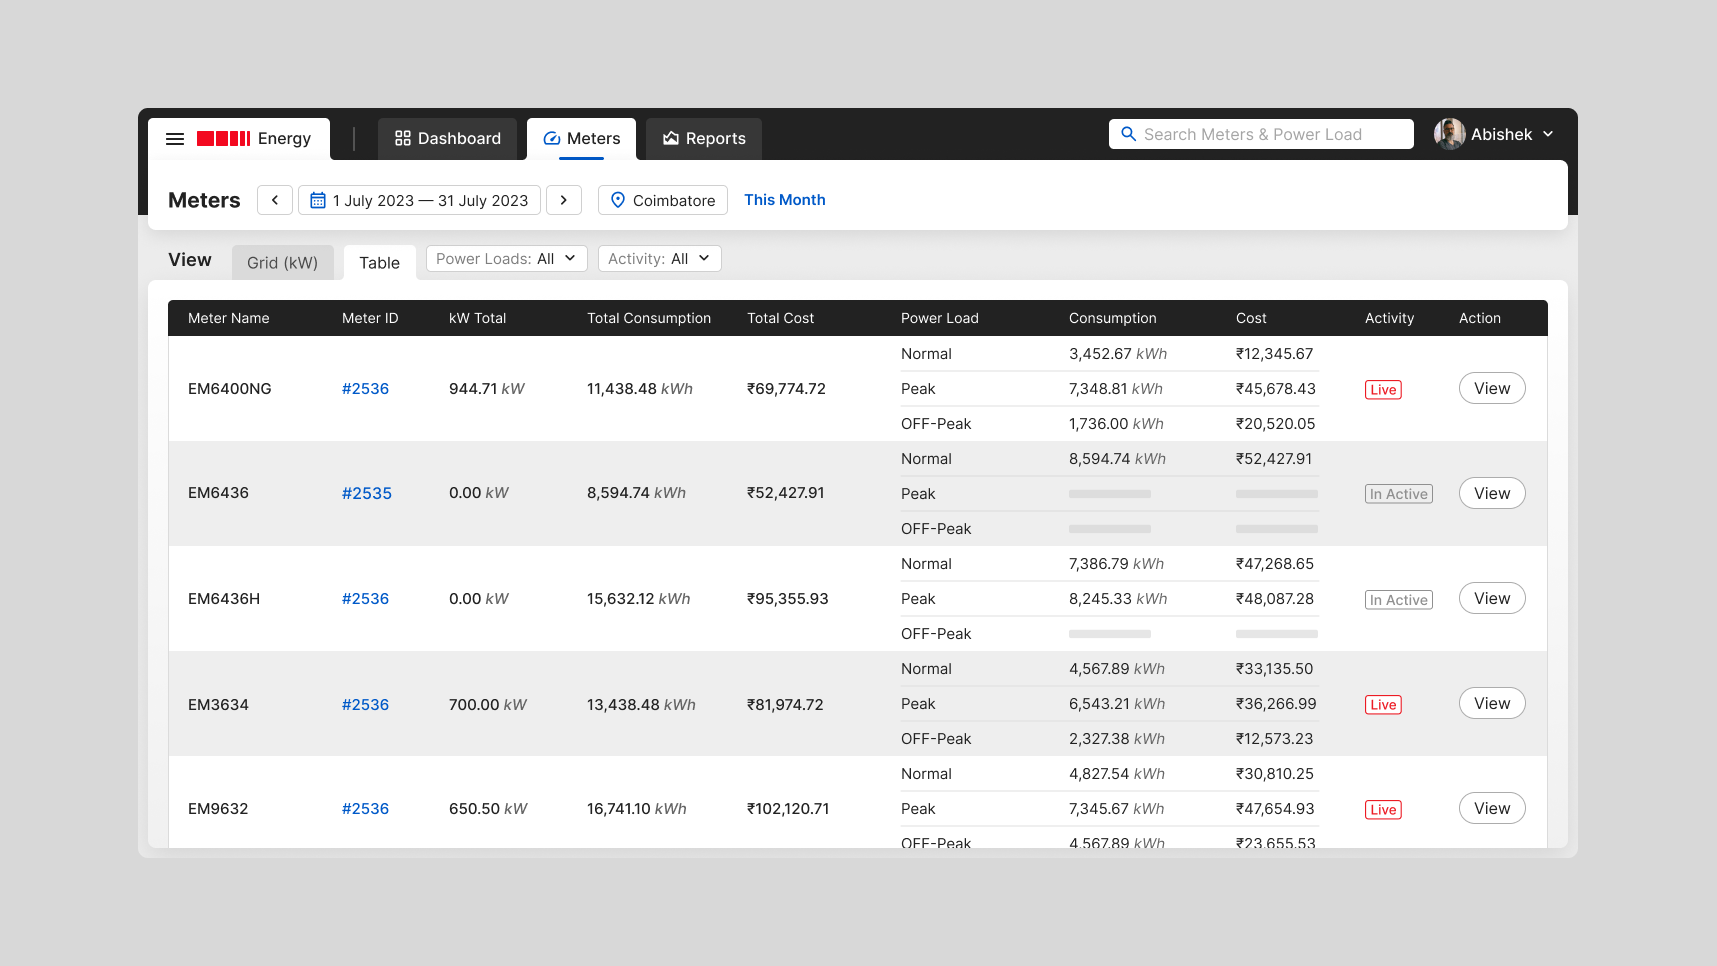
Our clients approached us with a request for a web application to efficiently monitor and manage energy consumption across all the machines operating in their production centers throughout India. They were grappling with the challenge of manual record-keeping and reliance on spreadsheets for data comparison and reporting. In response to their needs, we developed a comprehensive system that collects and processes data related to energy consumption from the machines. To enhance user experience and functionality, we structured the system into three distinct modules: Dashboard, Meters, and Reports.
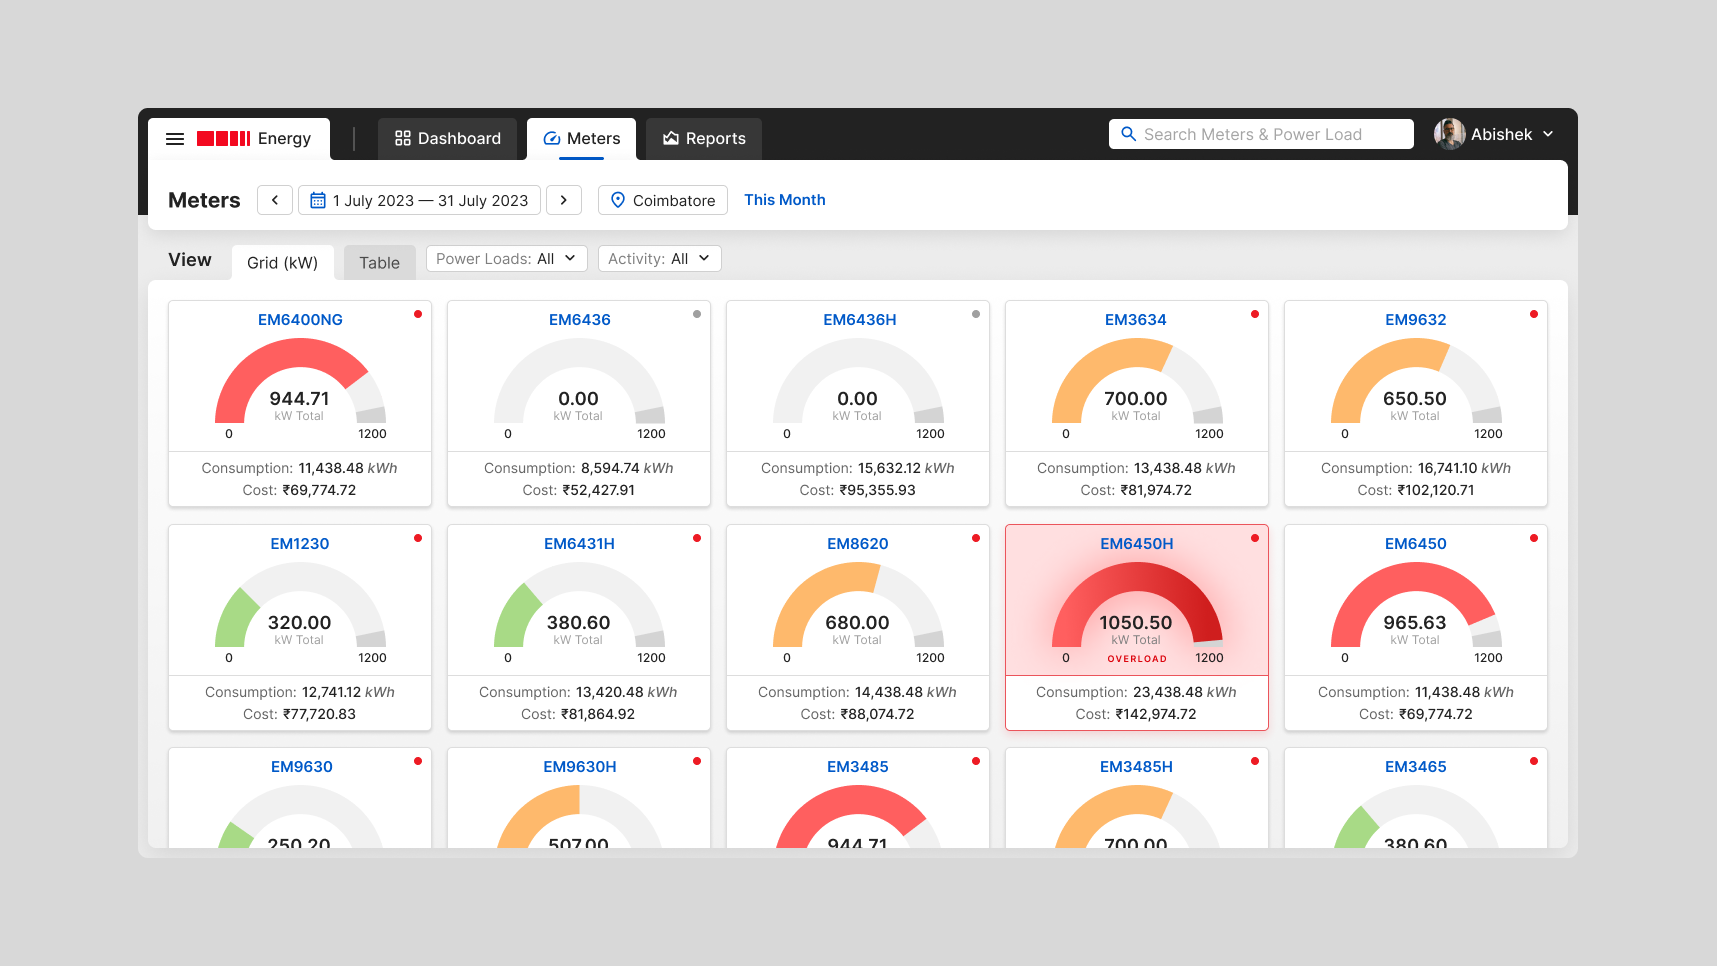
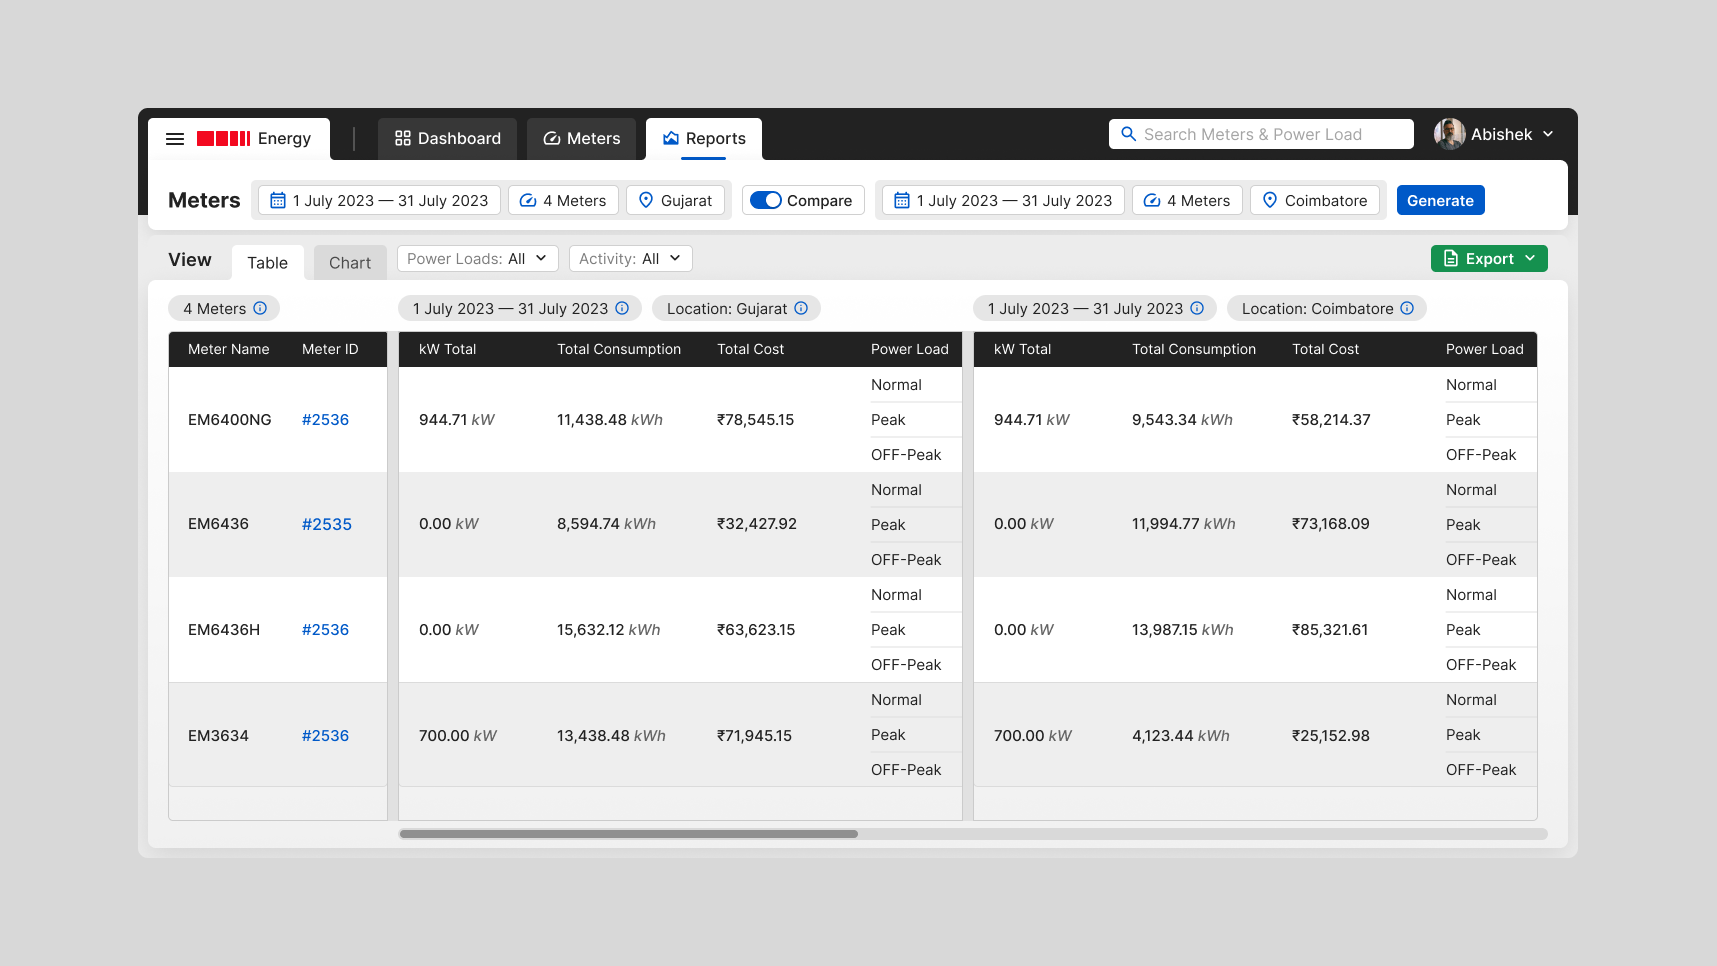
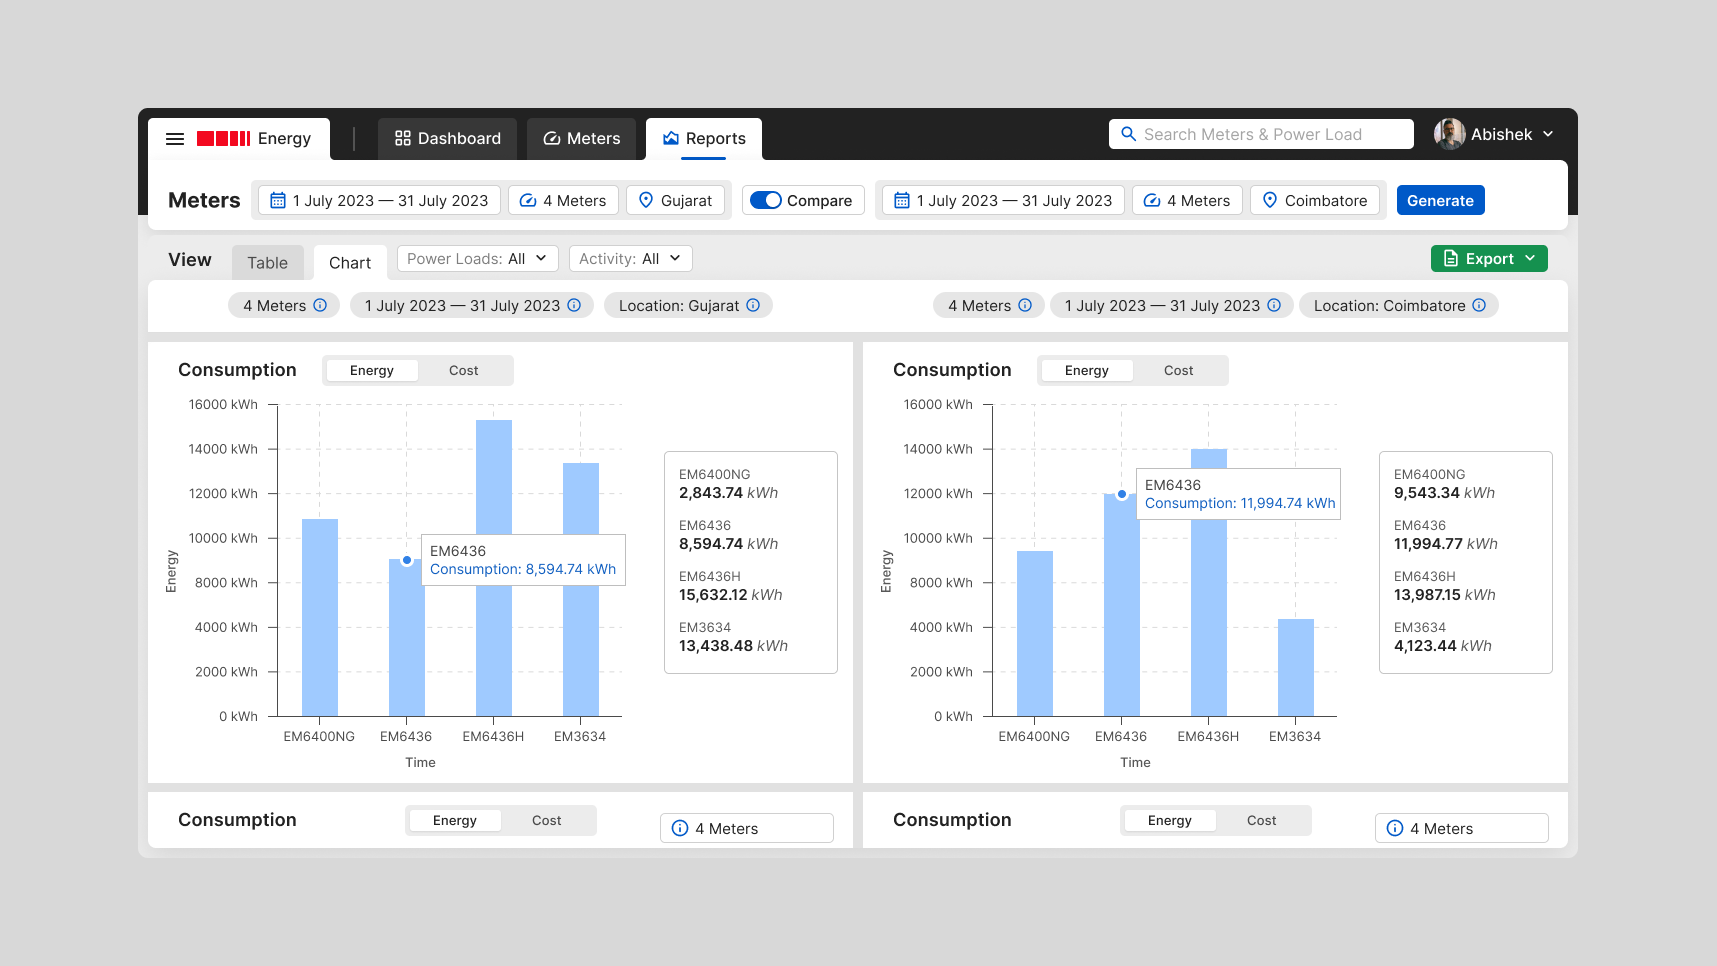
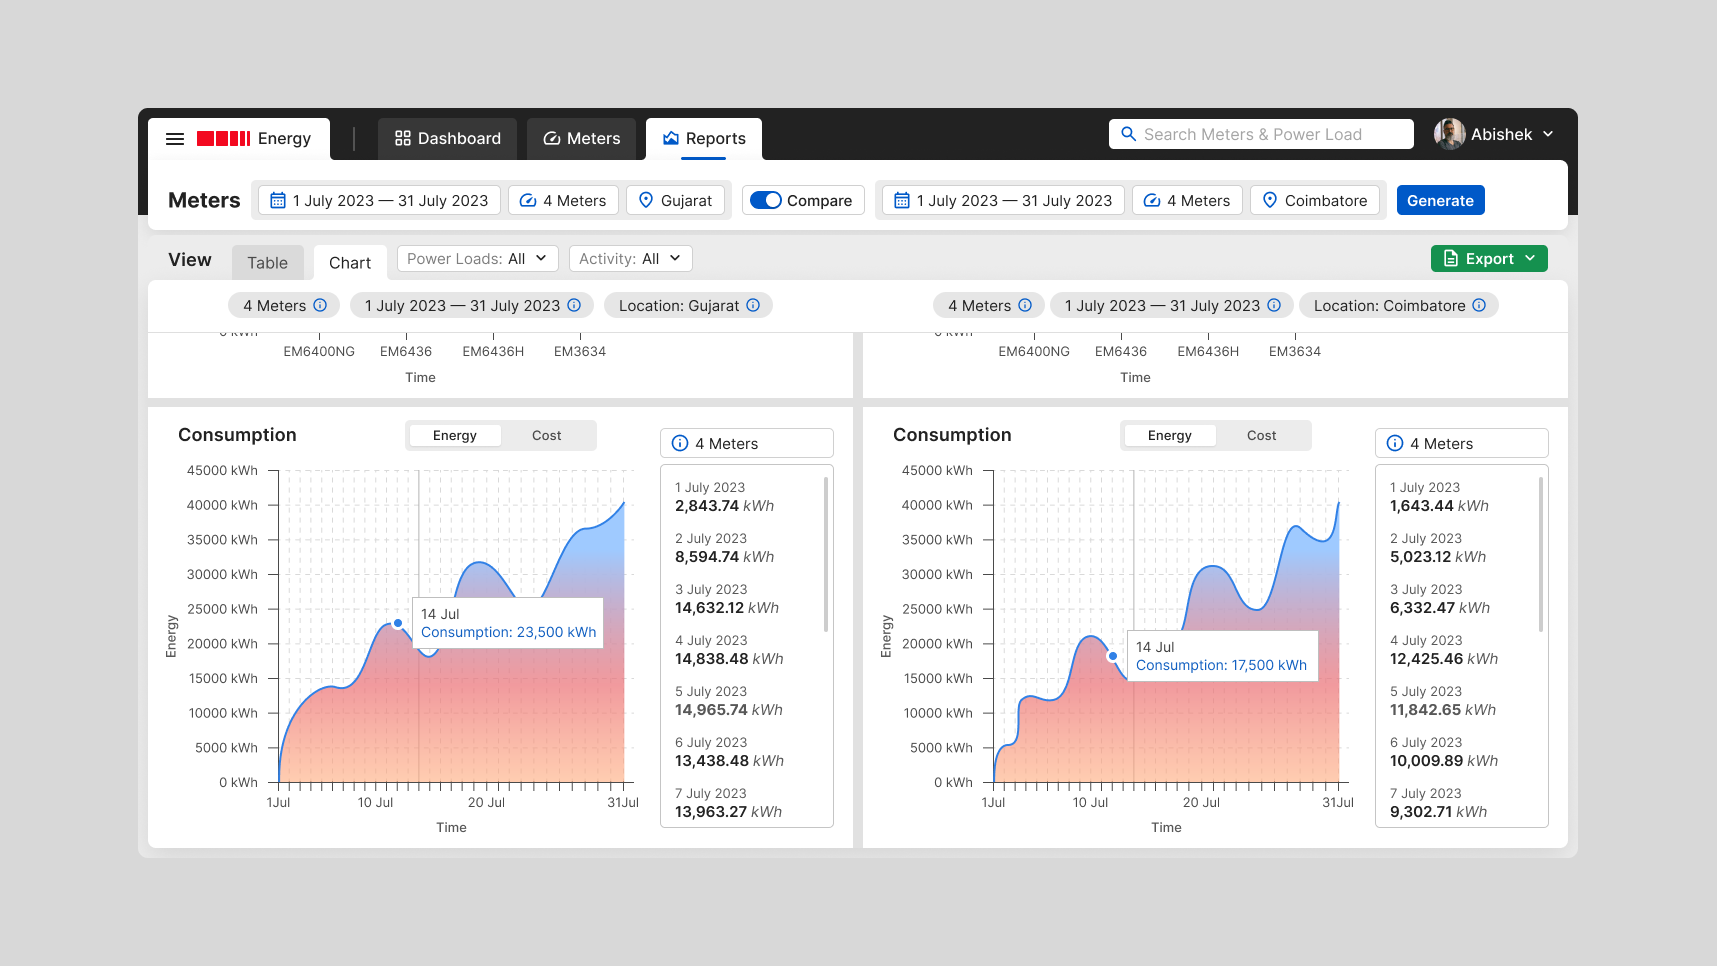
The Dashboard serves as a real-time hub where live data from the machines is displayed, and users can apply filters to access historical data for comparison. The Meters module is designed to provide an organized display of all energy meter data, ensuring that users can easily access and monitor this crucial information. In the Reports module, we empower users with the ability to generate comprehensive data reports. These reports can be tailored based on data, time, and location criteria, and they also include a comparison feature for more in-depth analysis. This system represents a significant improvement over manual processes and spreadsheet-based management, offering our clients a more efficient and user-friendly solution to monitor and manage energy consumption across their production centers.
